Solar farm site screening using DataHive GIS data

Automated GIS data for faster solar site location selection
DataHive × LUUCY Partnerschaft
Efficient analysis of potential solar sites by screening across multiple GIS sources.
Automated aggregation and cleaning fragmented public geodata.
Keeps location inputs updated to reduce outdated decisions.
Key challenges

Analysis of fragmented GIS inputs is inefficient and prone to errors.

Customer builds solar farms in the USA and manually collects and analyses scattered site data from many geoinformation sources.
1

Too many factors limit the depth of a manual site analysis

Think network capacity, flood zones, terrain slope, distance to critical- and electrical grid infrastructures, and more.
1

Data is scattered across sources

Public data exists, but it is spread across many source systems and formats.
1

Manual work is inefficient

Manual collection is slow and error-prone.
1

Data gets outdated, challenging to see the larger picture.

Network capacity changes often; stale data can drive wrong investments.
Solution Framework

Automated screening with DataHive GIS services

We automate data extraction, filtering, and GIS delivery.
Contact an expert

Geospatial processing

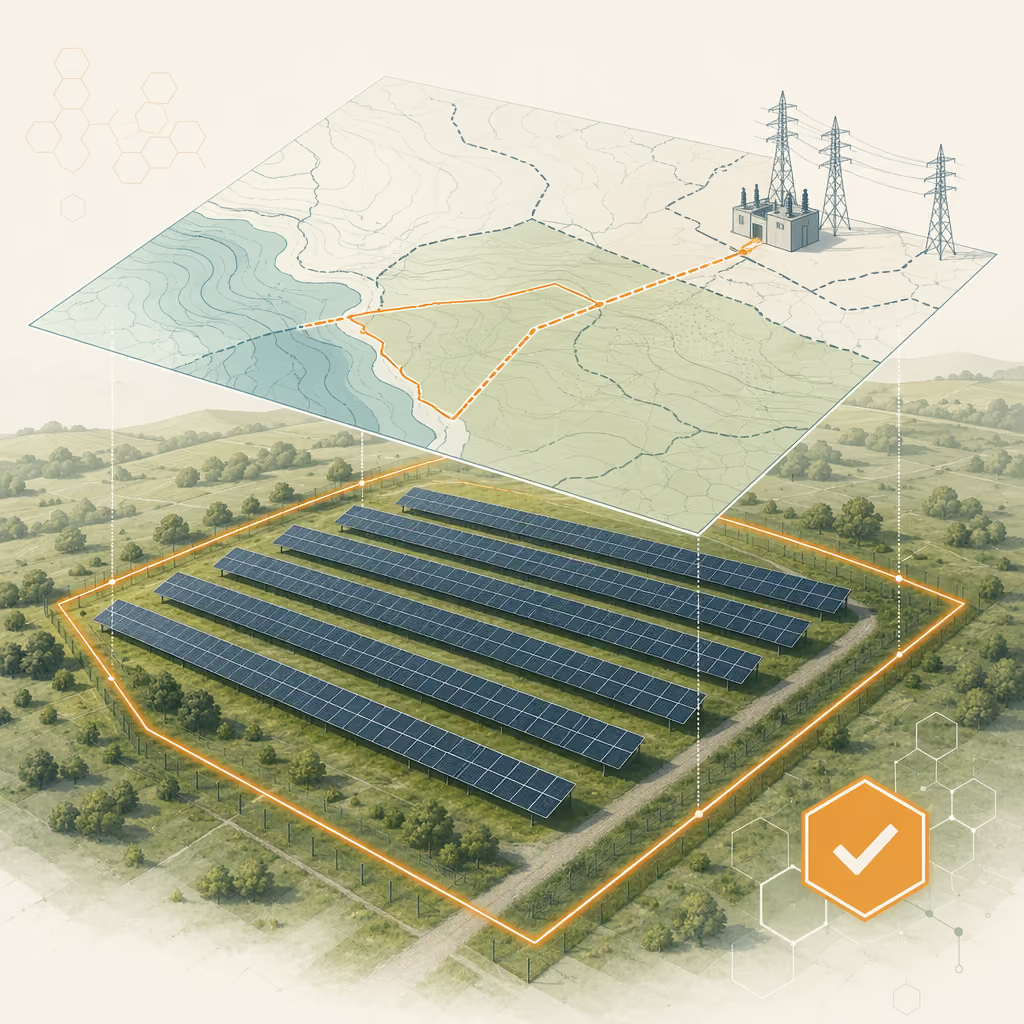
Including raster and vector processing to combine terrain models with cadastre data to assess slope, exposure, and soil conditions. 

Topology-based assessment of economical feasibility

using distance to feeder lines / substations to assess access and connection costs, and parcels to grid infrastructure to identify protection rules or risks.

Continuous delivery of automated data extracts.

Consolidate geodata from portals, GIS platforms, and databases. Clean, up-to-date, directly into ArcGIS, QGIS, and more.

KPI-based filtering prior to investing resources

Filtering of parcels possible based on customer KPIs before deep analysis.
Key results

Faster, more confident solar site selection

Quicker investment decisions can be made based on always-up-to-date site data. No extensive manual work required. 

Less manual collection

Data is aggregated and cleaned instead of copied by hand.

Earlier exclusion of bad sites

KPI filtering removes unsuitable parcels before deeper work.

GIS-ready outputs

Data can be analysed directly in ArcGIS, QGIS, and platforms.
Map view showing nearby daycare centers, public transport, shops, parks, and services around a property.
Before vs. After with DataHive
Solid line: actual performance; dashed line: target or benchmark
Trends 2024 vs. 2025
Highlights improvements and changes between the two years.
How DataHive helps

What DataHive does for you

Unique selling point

Before DataHive

After DataHive

Data collection
Manual / fragmented
Automated / standardized
Data processing
Extra cleaning needed
Filtered by KPIs
Update cycle
Infrequent or delayed updates
Continuous updates
GIS Usage
Many formats to be consolidated
ArcGIS/QGIS-ready
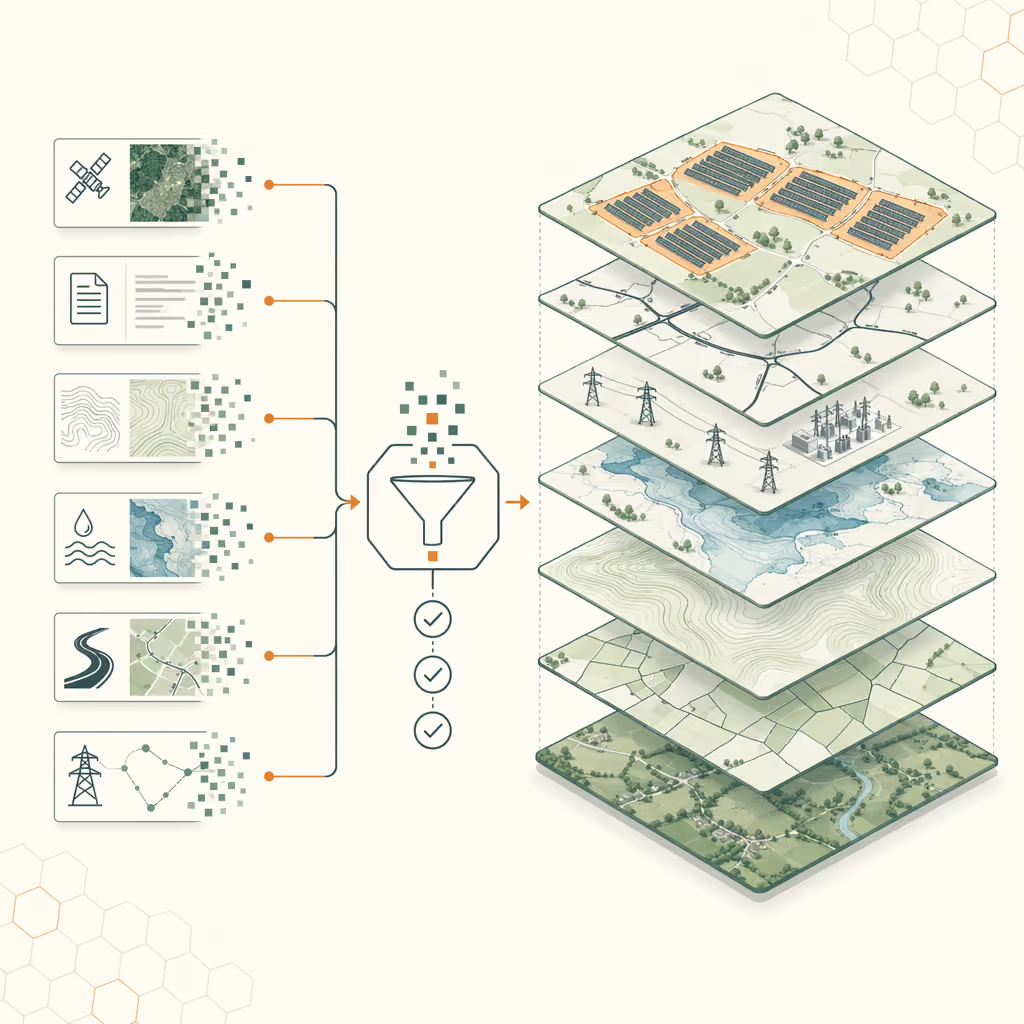
Diagramm eines automatisierten Solar-Standortscreenings von der Datenextraktion bis zur GIS-Visualisierung.
Concrete results

Our approach in action

Workflow: extract geodata, filter by customer KPIs, run raster/vector and distance analysis, deliver to GIS tools.
Let’s Collaborate

Interested in solar farm investments?

Or screening parcels for other purposes?
Contact us for a non-binding discussion our data services and how we can support you.
Thank you! Your submission has been received!
Oops! Something went wrong while submitting the form.

Frequently Asked Questions

How do you set up solar farm screening based on our KPIs and decision criteria?

As a customer, you define your KPIs and decision criteria for solar farm investments. DataHive provides the data you need directly into your analysis platform. During the onboarding phase, we support you in configuring the platform in the way that works for you, based on your filtering criteria. When desired we do onboarding workshops or regular check-ins to get the system work best for you and your team.

How do you assess terrain and site constraints using raster and vector data?

We combine raster data (digital terrain models) with vector data (cadastre data). This enables a detailed topographic analysis, including slope, exposure, and soil condition.

How do you evaluate grid connection feasibility and exclude non-viable sites?

We calculate distances to feeder lines and substations, not only straight-line distance. We account for geographic barriers to estimate effective connection costs. We also quantify how many parcels lie between a site and the grid, and apply topology-based selection using landscape structure, road networks, and supply areas to filter out sites that are not sensible to connect for economic reasons or due to ecological protection measures.

What other types of parcel-level data can you provide?

DataHive offers a variety of data types focussed on the real estate market including geodata, building and housing metrics, construction planning and legal frameworks, environmental risks, energy and mobility data, population and household data as well as real estate market data. Most of our data is focussed on Switzerland, but we also work on custom projects in other geographies or data areas that are not included in our current portfolio. If you are interested to learn more, schedule a non-binding meeting with one of our experts to talk about the feasibility of your data project.
Are DataHive’s services limited to certain geographies?

Most of our data is focussed on Switzerland, but as evident from this particular use case, we also work on custom projects in other geographies or data areas that are not included in our current portfolio. If you are interested to learn more, schedule a non-binding meeting with one of our experts to talk about the feasibility of your data project.