DataHive × LUUCY Partnership

Data-driven 3D planning for Swiss densification
DataHive × LUUCY Partnerschaft
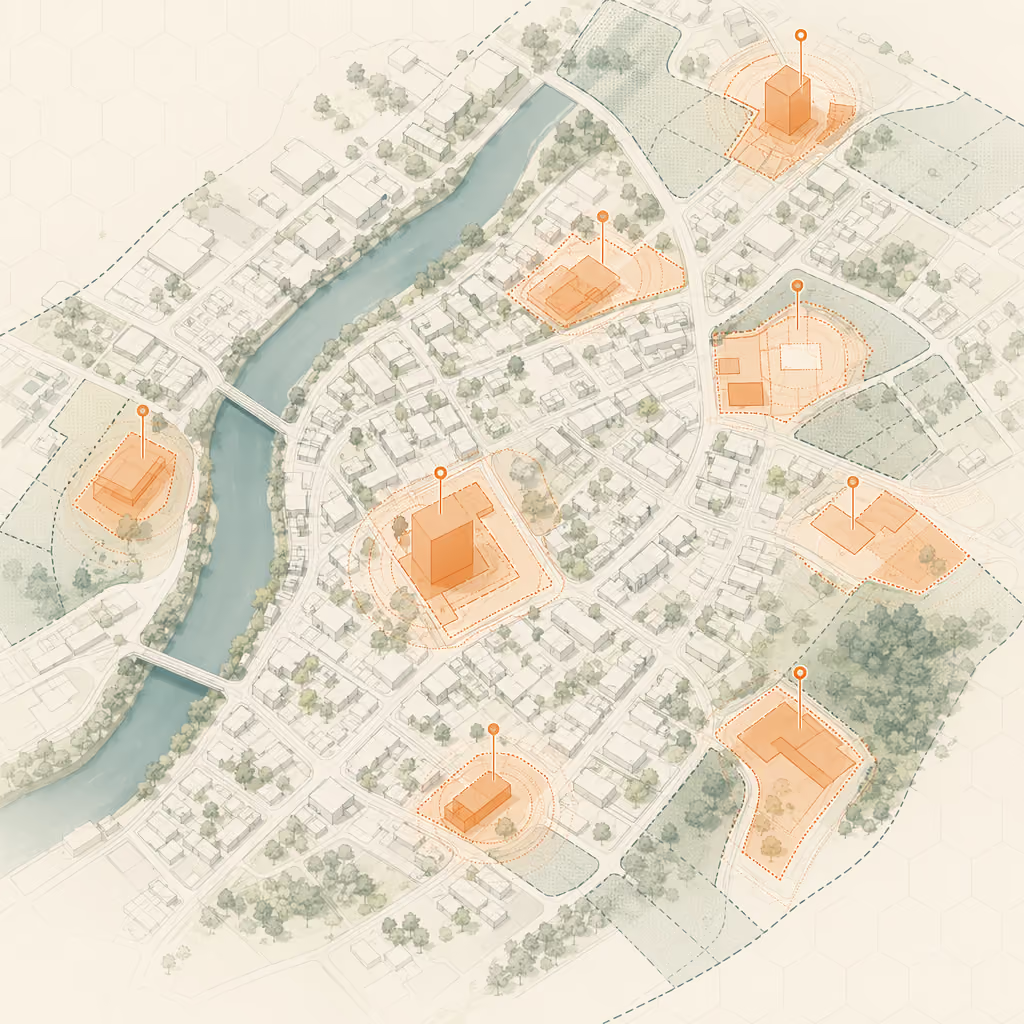
Parcel-level development potential within the LUUCY 3D context
Visualize densification options for existing buildings
Transparent insights into the impact of zoning revisions at scale
Key challenges

Make housing growth possible

LUUCY provides a SaaS platform for 3D planning of buildings. To provide their customers the best renderings, LUUCY relies on quality data to find building and densification potential.
1

Solve the housing shortage pressure

Communities must find ways to unlock housing without urban sprawl.
1

Find hidden densification reserves

Potential exists not only on greenfields, but also in existing assets.
1

Make sense of complex rules and limits

Building laws, zones, and restrictions must be understandable for every parcel.
1

Stakeholder alignment

Politics and society need transparent visuals to discuss trade-offs.
Solution Framework

Quality data visualized in 3D

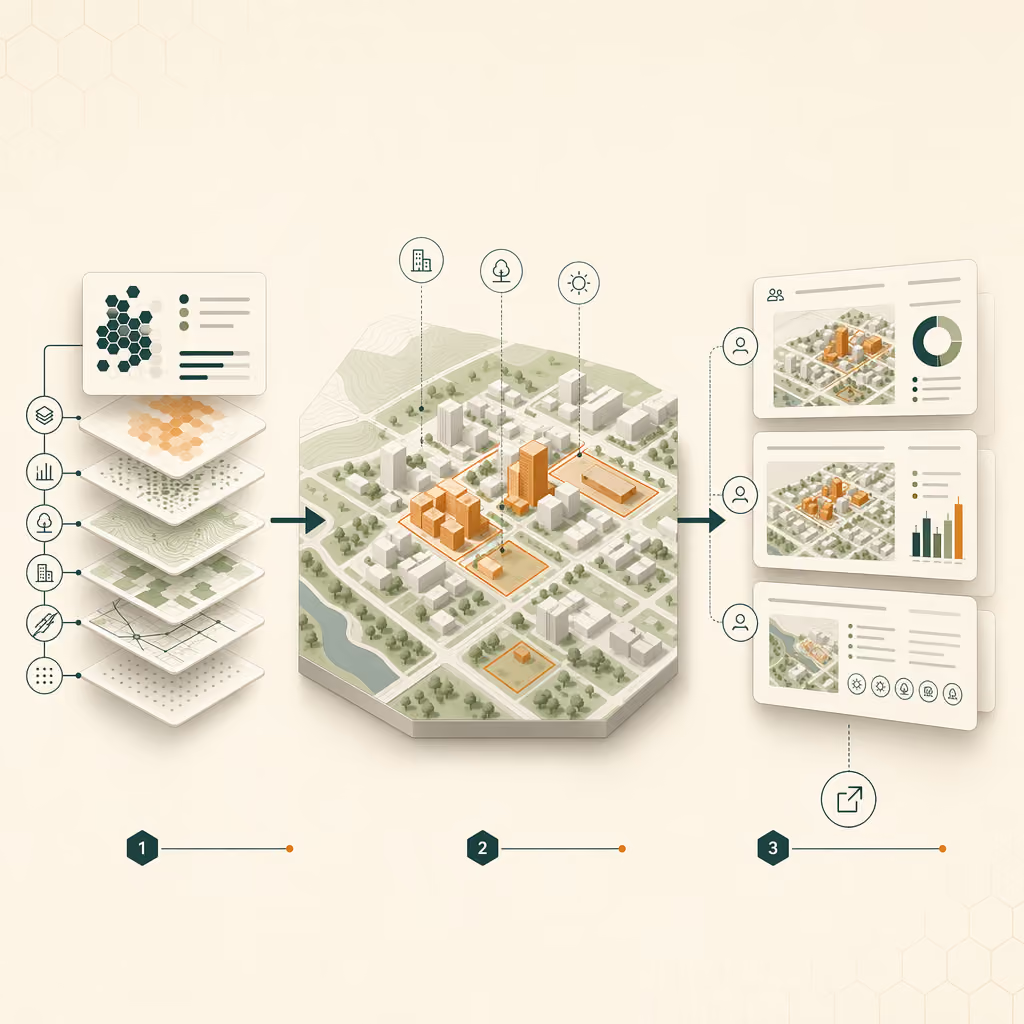
DataHive supplies building potential data. LUUCY visualises it in 3D.
Contact an expert

Parcel and object-level potential

Building and densification potential at the parcel and object level.

Utilization reserves and limits

Displays utilization reserves and planning restrictions for various scenarios.

Zones and building lines

Includes usage zones and building lines for spatial context.

Visualize zoning revision impacts

Make the impacts of zoning plan revisions visible across different areas.
Key results

Turning data into buildable scenarios

The collaboration brings practical advantages to municipalities, investors and urban planners, who now have access to the most up-to-date data to assess growth, limits, and densification in 3D through the LUUCY platform, and easily share scenarios with stakeholders.

Support strategic data-driven growth planning

See where development potential exists, limits apply and identify opportunities for add-ons, extensions or replacements.

Attractive visualization of analyses and potential trade-offs

Quality data made available in different formats, from simple Excel analyses to interactive maps, making it easy to explain zoning revision impacts clearly internally as well as to stakeholders in politics and society.
Map view showing nearby daycare centers, public transport, shops, parks, and services around a property.
Before vs. After with DataHive
Solid line: actual performance; dashed line: target or benchmark
Trends 2024 vs. 2025
Highlights improvements and changes between the two years.
Datenfluss von DataHives Baupotenzial-Datensätzen in LUUCYs 3D-Planungsansichten für Gemeinden.
Concrete results

Our approach in action

An interactive example of the LUUCY platform for the municipality Hergiswil. The model provides different data-layers including: 

Digital building regulations, zoning plans.
Calculations of all limitations—from floor area ratio / utilization index to gross floor area ratio, to setback distances—measured against the actual parcel geometry
Regulatory constraints
“By working with DataHive, we have a solid data basis of building-law rules and can show in 3D where parcels still have building potential.”
Daniel K., Head of Real Estate Development
Let’s Collaborate

Explore real estate ad data for your market

Tell us your target region, criteria, and preferred workflow. We will show you how DataHive’s real estate ad data can support seller outreach, competitor monitoring, and local market intelligence.
Thank you! Your submission has been received!
Oops! Something went wrong while submitting the form.

Frequently Asked Questions

Does this cover only greenfields, or also existing buildings?

The partnership focuses on development opportunities of existing buildings too. It highlights where add-ons, extensions, or replacement builds can unlock additional capacity in existing areas offering additional living space, without sacrificing green zones.

How are zoning plan revisions handled and shown?

The collaboration aims to make the effects of zoning plan revisions visible across areas, so municipalities and stakeholders can discuss impacts transparently.

How does DataHive deliver the data into our workflow?

DataHive can deliver data in formats like Excel/CSV/JSON, via API, dashboards, FTP, or direct integration into existing systems (e.g., CRM) - so teams can keep working in existing tools without changing their workflows. During onboarding, we offer consultations to show you and your team the possibilities and set up the system in the way that it works for you. If additional consultations or training are needed we organize these with our data experts based on the needs of our customers.

What does a typical engagement look like?

DataHive typically starts with a needs discussion, provides a proof dataset for the use case, then scales delivery and maintains ongoing updates and support as agreed.